
Root Cause Analysis: Ishikawa Diagram
The "Ishikawa Diagram" is a powerful tool used for root cause analysis, which as discussed in other posts is one of the necessary steps in problem solving techniques (see post).
It was developed by the Japanese engineer Kaoru Ishikawa in 1943, and it is a diagram in which, starting from the effect or problem occurred, all its possible causes are identified.
The importance of Ishikawa Diagram
Ishikawa Diagram helps us to recognize the cause-effect relationships between problems and the different variables that can cause them.
By applying this tool in a standardized way and as a team, we can identify areas that may contain possible causes that we were not taking into account and for which we did not have data.
Ishikawa Diagram Elements
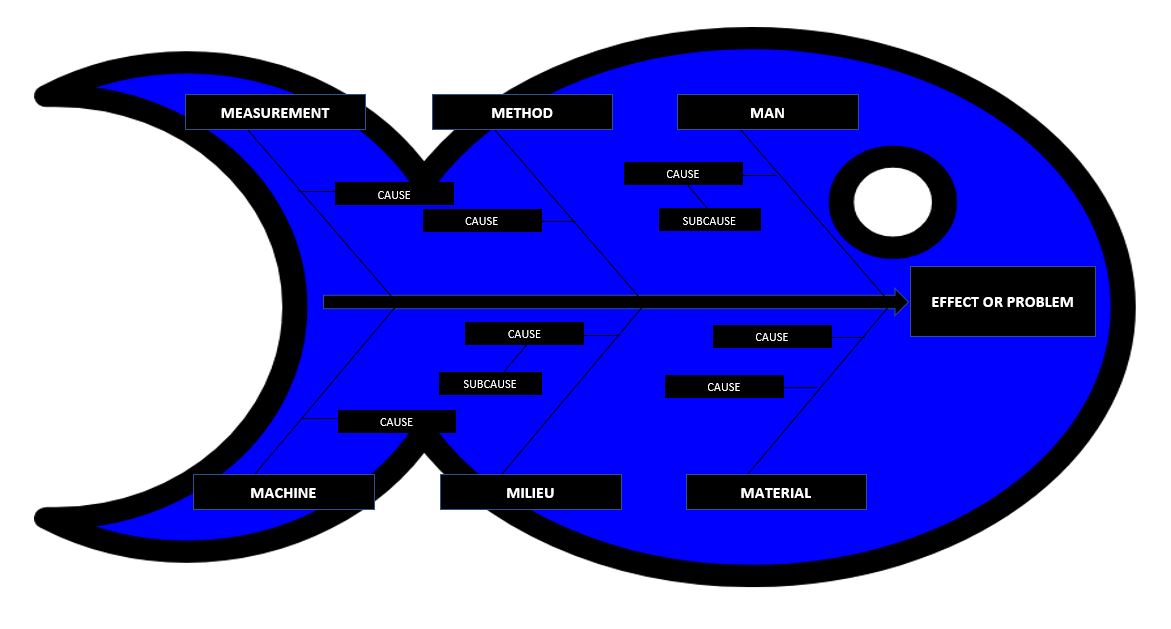
This tool is also called "Fishbone Diagram", since it has the parts of the skeleton of a fish, head and fishbones:
- In the head, which emerges from the central spine, is the part where you will put the effect or problem that is occurring.
- In the main fishbones will be placed the categories of possible causes that belong to the 6Ms of production (man, machine, material, method, mother nature and measurement).
- In the secondary fishbones will be placed the possible causes that can cause the mentioned problem to occur. There may even be even minor fishbones that determine minor causes.
How to perform an Ishikawa Diagram?
Ishikawa diagram should be structured as a "brainstorming" with a multifunctional team, which will allow us to categorize all possible ideas.
One way to proceed would be as follows. We could use a whiteboard and marker or any digital media that replaces them.
We are going to use the example of a quality issue at a cell phone factory where a device was distributed with a problem in which the flash did not work for the customer. The manufacturing process is performed by an operator manually assembling the components and then connecting it to a machine that checks and detects that the flash is working.
Step 1. Identification and problem definition
All participants must agree on the identified problem (effect).
In the example we have used, it is clear that the definition of the problem (the effect on the client) would be: "Mobile Camera Flash does not work".
Step 2. Documentation of the problem
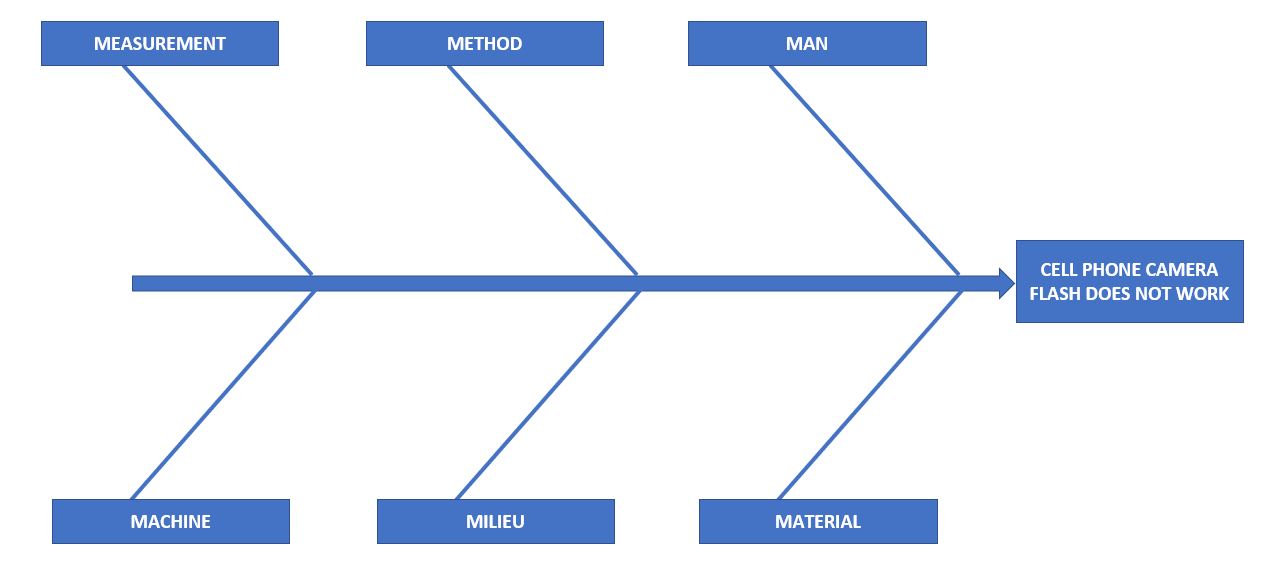
Subsequently, we will write at the far right of the center of the blackboard and surround it with a rectangle. Then draw an arrow pointing to this rectangle which, as mentioned above, represents our problem (effect) to be analyzed.
Applied to our example it would look like this:

Step 3. Categorization of causes (standard)
Here the different factors that may be causing the problem will be categorized. Lines proceeding from the "main fishbones" will be drawn with the different categories.
The following categories of possible causes belonging to the 6Ms of production (man, machine, material, method, mother nature and measurement) will be used as standard.
- Machine: all causes related to the machinery in charge of producing the product, including here also tooling (injection molds, stamping dies, etc...). It may include technical problems of alignment, etc., problems inherent to the type of machine selected for production.
- Method: refers to the production process and also to all those operations and methods that contribute to its realization.
- Manpower: includes all labor used for the production and distribution of the product. This is one of the categories that should be used the least. Never ask "Who" but "Why".
- Material: this category refers to all causes related to raw materials, purchased components, consumables... used for production or service to the final customer. The causes here are usually incorrect specifications, mislabeled, incorrectly stored, expired, etc...
- Milieu (mother nature and environment): includes all those causes related to weather and environment, be it floods, earthquakes, and other events. Most of these environment-related factors can be foreseen and managed in the factory.
- Measurement: causes related to inspection and measurements (distance, volume, temperature, pressure) either manually or automatically. Sometimes measurements may not be robust or capable from a process point of view which can lead to wrong decisions being made by the production team.
Let's put the categories in our example:
Step 4. Identification of potential causes (Brainstorming)
In this step we will identify as a team the potential root causes behind each of the above categorized factors.
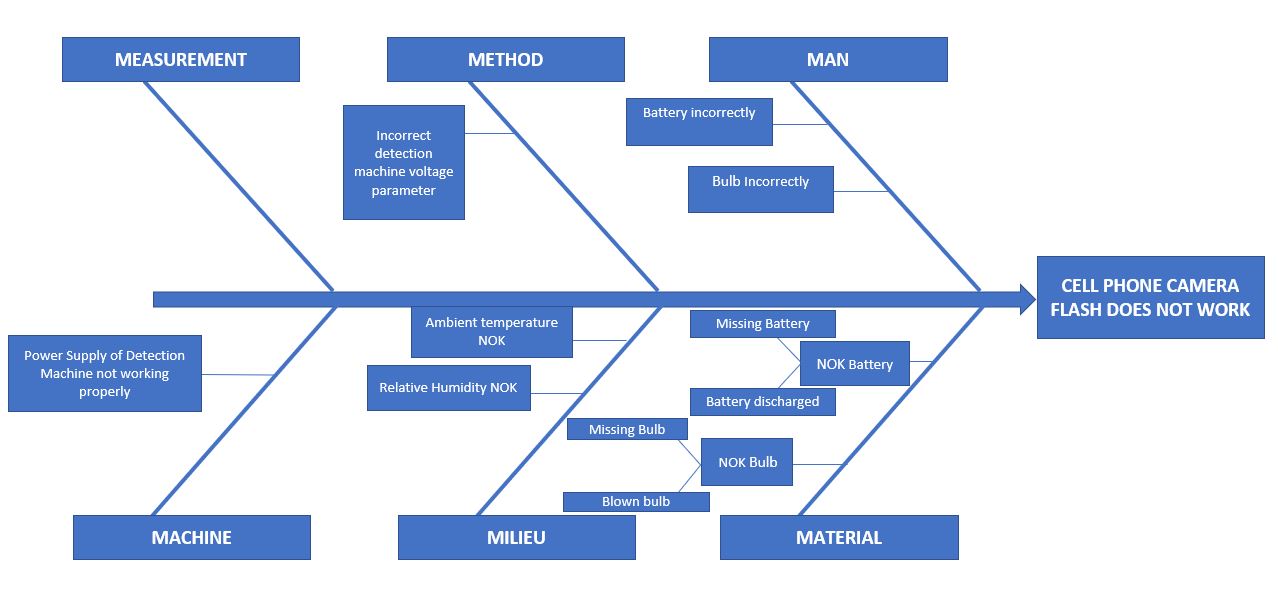
From each of the lines pointing to each category we will draw horizontal lines (secondary fishbones) that will identify the possible causes. It may be the case that more fishbones need to be drawn within these in the event that the root cause is quite complex.
Applied to our example we would have the following:
Step 5. Final analysis of the diagram
At this point a review is made of each of the potential causes and a decision is made as to which ones should be eliminated (as they are not root causes) and which ones could be the root cause of the problem and require further analysis.
The next step would be to implement corrective actions on the selected root causes and validate with data the improvement that corrects the problem. In this way we will validate the hypotheses on the selected potential root causes.
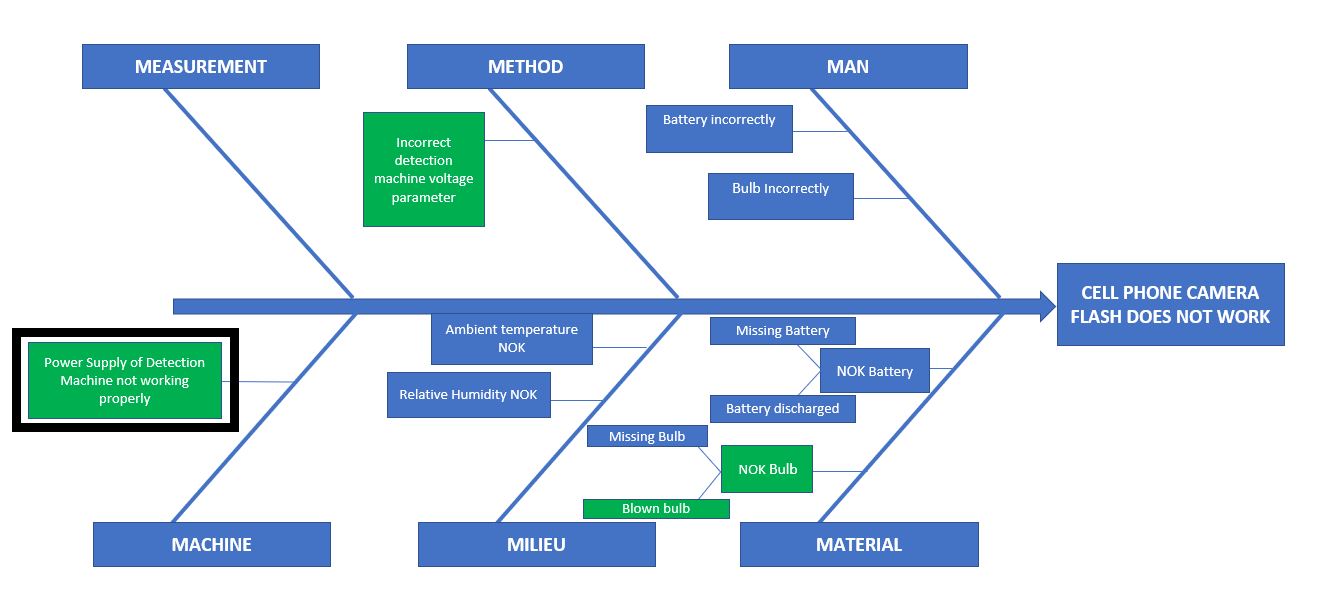
In the example, after a quick physical analysis of the device, it is seen that the bulb was fused, so the following are chosen as potential causes of the failure:
- Incorrect voltage parameters in the detection machine.
- Incorrect detection machine power supply (not working properly).
- Blown bulb as component.

After verifying that the voltage parameters of the detection machine are correct, and seeing that the bulb was not fused from the supplier, i.e. that it was fused after passing through the process, it is hypothesized that the power supply of the detection machine is incorrect and subsequently validated after measuring voltage variations. Therefore the root cause is an overvoltage caused by an incorrect power supply.
How to combine the five whys and the Ishikawa diagram?
The most correct way to achieve a correct root cause analysis is by combining the Ishikawa and the 5 Whys as follows:
- We will use the Ishikawa diagram to find all those potential causes to our problem with the steps mentioned above.
- Once we have these potential causes, if applicable, we will delve deeper into them by performing a 5 Whys analysis to get to the true root cause of the failure mode.