
Power BI and its potential application in production environments
What is Power BI?
Power BI is a unified platform from Microsoft used for data analysis and visualization. Among its main features are:
- It can connect to various data sources.
- It can transform and clean data as needed.
- Creation of visual and interactive reports.
- Development of customized dashboards.
- Facilitating collaboration and report sharing within the organization.
- Can integrate with other Microsoft tools, such as Excel and Azure.
Power BI is widely used in enterprises to make decisions based on data and performance indicators.
How does Power BI work?
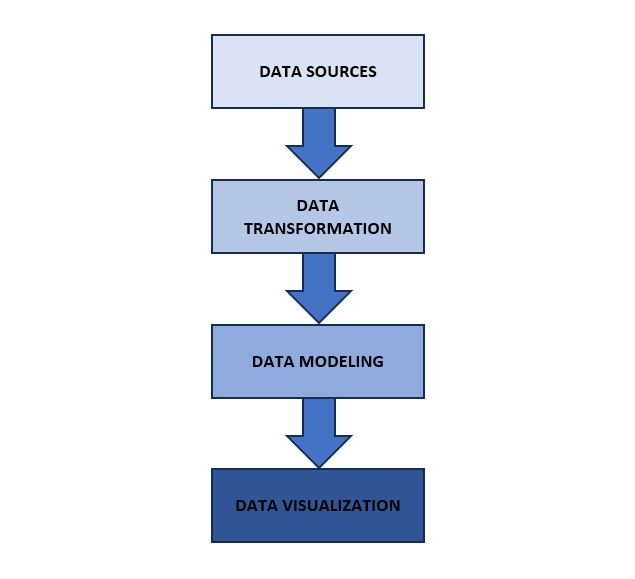
How Power BI works could be divided into the following phases:
- Data loading
- Data transformation
- Data modeling
- Data visualization
First phase: Data loading
In this phase the loading of the data to be analyzed is carried out.
Power BI offers the possibility of connecting to multiple data sources:
- Excel
- txt files
- pdf files
- Databases
In case there is no direct connection possibility, connections could be programmed through its APIs.
Second Phase: Data transformation
The loaded data must be cleaned and transformed to be functional, otherwise the model will be heavily loaded with useless information that will slow it down.
Power BI has a tool called Power Query that allows to perform the data transformations, either by cleaning them, changing their form or changing their shape.
Third Phase: Data modeling
In this phase, operations are performed on the transformed data (through a language called DAX) and connections between the different data are generated.
Fourth Phase: Data representation and visualization
In this last stage, the graphical representation of the data will be carried out through graphs, tables, maps, interactive panels, etc.
It is important to note that the information must be continuously updated so that the interactive panels fulfill their function of supporting decision making.
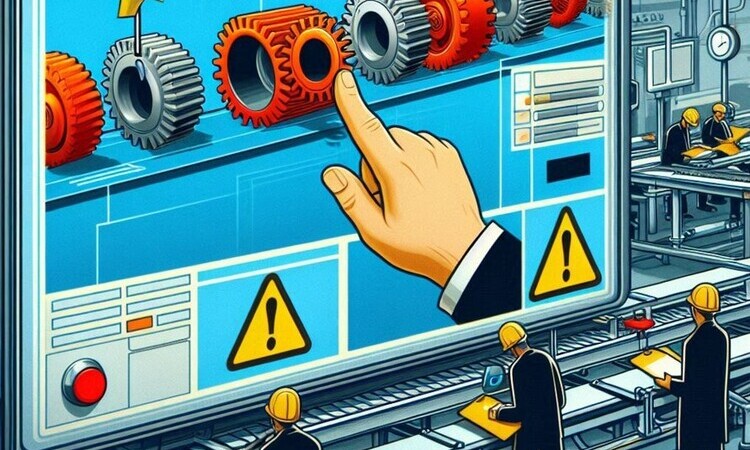
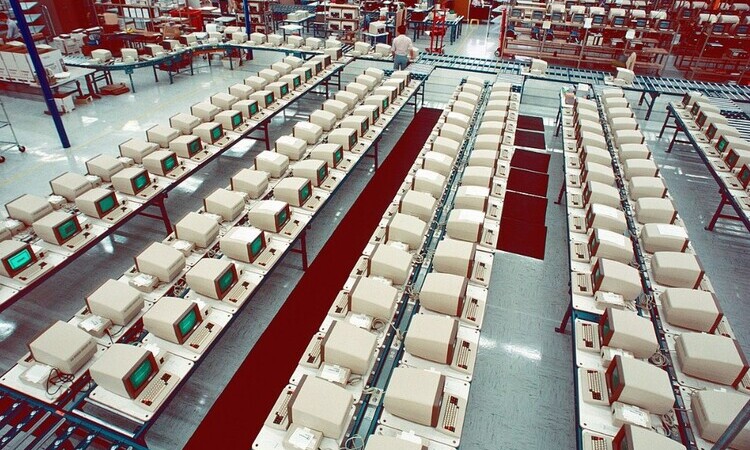
How can Power BI help the manufacturing industry?
Data visualization and Business Intelligence tools, such as Power BI, help the manufacturing industry reduce data redundancy and improve decision making.
Evidence shows that most companies make decisions based on outdated data (not in real time), which leads to suboptimal decision making. Power BI can display customizable key KPIs for each organization allowing the identification of trends and patterns for real-time data-driven decision making, promoting a data-driven business culture, not just for senior leaders.
Now we will see what Power BI can bring to the different areas of the company.
Logistics and Supply Chain
Power BI can be of great help in both internal logistics (suppliers) and external logistics (customers). By developing the appropriate indicators and graphs, it will be possible to control in real time:
- Raw material inventory levels, avoiding stock breaks that imply line stoppages.
- Status of supplier shipments, to ensure that supplier trucks arrive on time with the quantity demanded.
- Finished product inventory levels, to ensure that we have product available to ship to the customer.
- Status of shipments to final customer, to ensure that trucks arriving on time with the quantity demanded.
These indicators are usually in the companies, but as we have mentioned, they usually handle outdated data, besides having a much less visual way to follow them than Power BI, involving more effort and time for logistics control, being also less efficient in decision making.
Production Control and Planning
Using this tool we will be able to have a complete control over the production with indicators and graphs that will inform in real time of:
- Planned Production vs Actual Production, to control if we manufacture everything that has been planned.
- Development of an OEE dashboard (see post), that controls the efficiency of the lines collecting information about:
- Actual Cycle Time vs Theoretical Cycle Time, to control in real time if we manufacture to cycle.
- Number of manufactured and OK parts
- Number of scrap parts, with their defects categorized.
- Categorized unplanned line stoppages.
- Control of the Work In Process Level, to ensure that between the different processes of the plant there is semi-finished product ready to feed the next process.
All this will allow line managers and managers to see how production is going in real time at the click of a button, as well as perform data analysis for continuous improvement.
Maintenance
Through PowerBI you will be able to develop dashboards to track preventive maintenance planning in real time. It will be possible to follow relevant indicators such as MTBF (see post) or MTTR (see post) in a much more accurate way.
Through the use of advanced analysis techniques offered by PowerBI (regression, clustering, etc) you can perform predictive maintenance through the data we have from the devices that are connected constantly sending data.
Quality management with Power BI
PowerBI will allow us to develop fully customizable dashboards to suit each business. As commented for all the superior advantage of PowerBI is to offer the data in real time and in such a visual way. Some of the important indicators that should be in this dashboard would be:
- Percentage of scrap or PPM's depending on how you want to measure the defective.
- Pareto of defects, to allow us to focus on the most important ones.
- Number of internal quality claims referring to claims that have taken place within the plant. Let's imagine two processes injection + painting. If injection sends parts with defects to paint, paint will open an internal quality claim.
- Number of external quality claims, with our customers.
Purchasing Management
Purchasing management can also be done in a very visual way with the following KPIs:
- Price/piece comparison of products.
- Purchase orders per month
- Commitment amount per month
- Commitment amount per product
- Delivery lead time by product and supplier
These indicators would be very generic but like anything else, they can be customized to the needs of any business.
Sales Management
In the sales management it will be possible to make dasboards that include:
- Number of sales
- Revenue from that number of sales
- Revenue per product
- Sales price tracking
Financial Management
Financial management will use KPI's that are also known to all:
- Net profit margin: it would be the division of net profit by sales. This number reveals the efficiency with which your company converts revenues into profits.
- Profit margin, for the ratio of profit to gross revenue.
- Cost of non-quality, the cost of parts that are thrown away because they are not of the required quality.
- Cash flow, important metric because such surplus cash can be used to repay loans, make new investments or increase working capital.
- Overdue payments to suppliers